CDC Expands Respiratory Illness Trend Estimates to the Local Level: COVID-19, Flu and RSV Now Tracked by Health Service Area
The U.S. Centers for Disease Control and Prevention (CDC) announced on November 2 that its epidemic trend estimates, known as Rt, have been expanded to the health service area (HSA) level. Ahead of the fall and winter respiratory season, the public and local health departments can now check, week by week, whether COVID-19, influenza and respiratory syncytial virus (RSV) are growing, declining or staying the same in their own health service area.
Rt is the time-varying reproductive number, a data-driven measure of how fast a disease is spreading at a given moment. CDC's Center for Forecasting and Outbreak Analytics (CFA) provides the estimates weekly at the national, state and health service area levels, for COVID-19, influenza and RSV, with flu and RSV available seasonally. New interactive visualizations present the HSA-level estimates to help public health practitioners, health care systems and frontline responders with situational awareness, preparedness and resource planning.
Compared with surveillance-based methods, CDC said, Rt estimates can detect outbreak peaks 2 to 3 weeks faster at the state level and up to 1.5 weeks faster at the HSA level. The estimates are powered by data shared by state and local partners and by CDC analytics, based on emergency department visit data.
CDC's Respiratory Illnesses Data Channel also brings together local virus activity levels, wastewater testing, emergency department visits and test positivity. In its respiratory disease season outlook released earlier this season, CDC said it expects this season's combined peak hospitalizations from COVID-19, flu and RSV to be similar to last season's peak.
Source: U.S. Centers for Disease Control and Prevention
Published by GSM · USA (original Chinese edition)
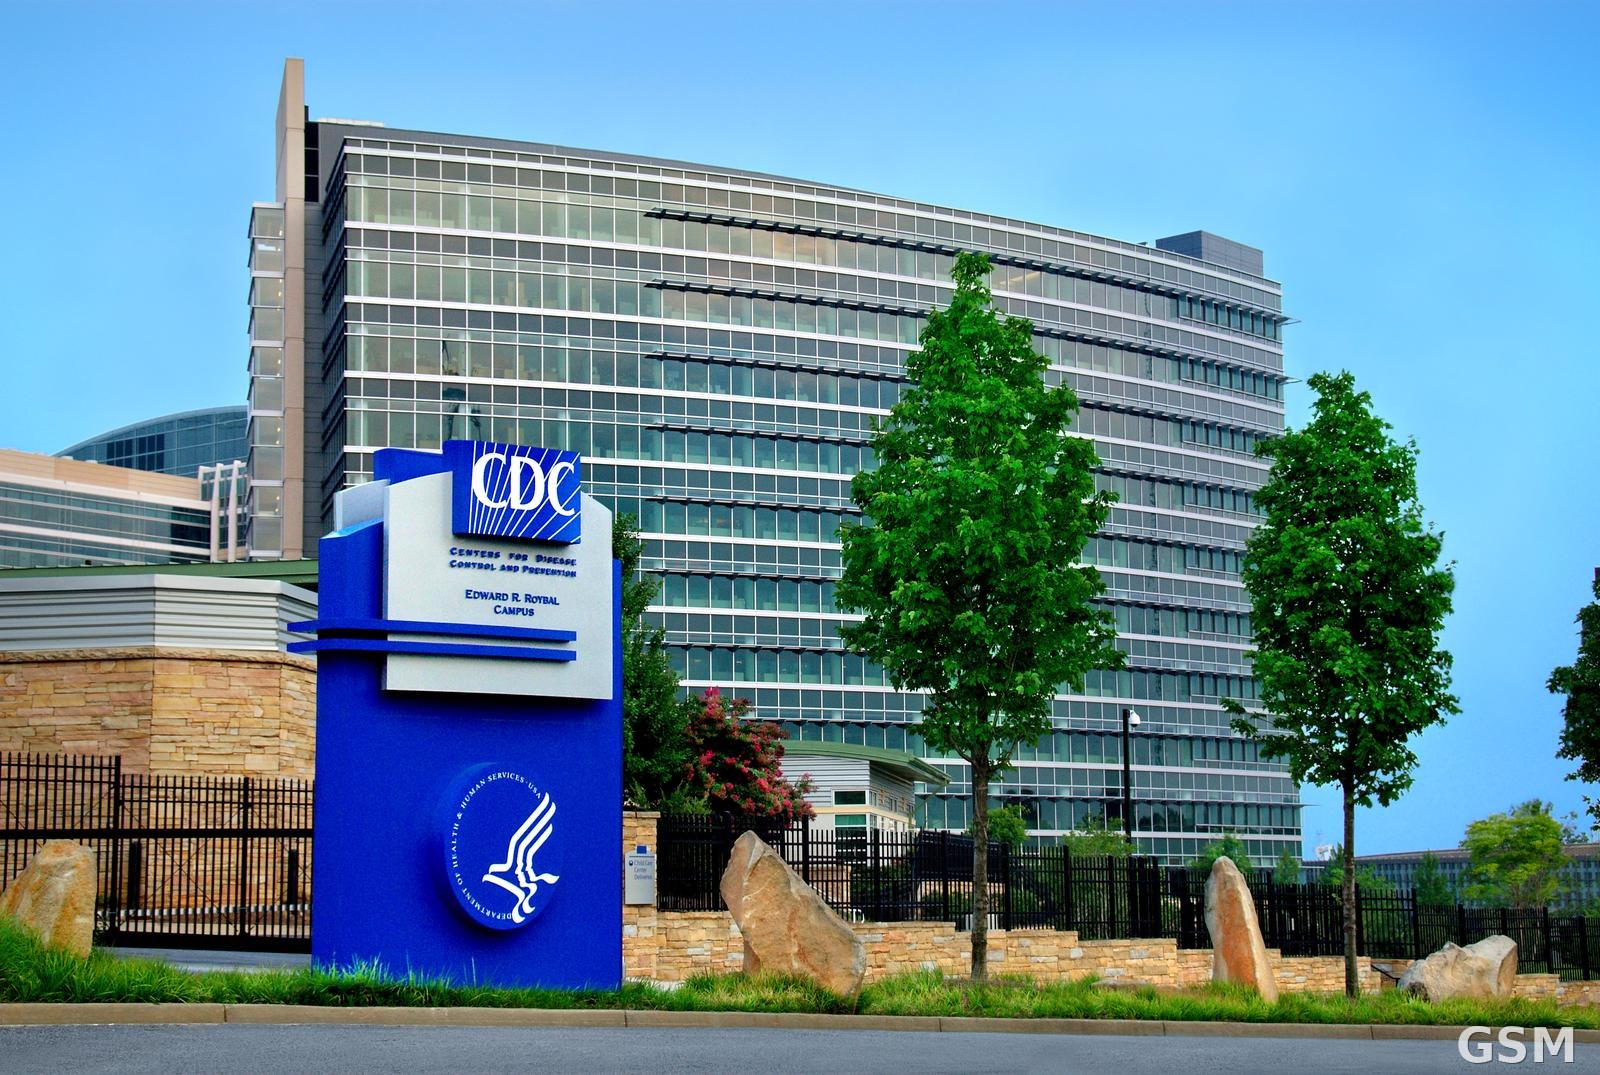
Photo: 图:位于 Atlanta 的美国疾病控制与预防中心总部大楼(资料图)。 / Photo: The headquarters of the U.S. Centers for Disease Control and Prevention in Atlanta (file photo).