Housing and School-District Homes: The House Next to a Good School
1. The district line is also a price line
In Southlake, Texas, the median home price inside the Carroll Independent School District is $2.16 million. Step outside the district boundary, and the median price in the same metropolitan area is $439,967. The difference is 391% (Realtor.com). Drawn on a map, that line is a school district boundary; drawn on home prices, it is a gap of more than $1.7 million.
Homes next to good schools have long been among the most expensive in the American housing market. A 2016 Realtor.com study found that homes in districts rated 9 to 10 by GreatSchools averaged $400,000 — 49% above the national median of $269,000 at the time, and 77% above homes in low-rated districts in the same area ($225,000). Homes in good districts sold eight days faster and drew 26% more views.
2. National prices: six years of increases
The national median existing-home price was $417,500 in September 2026, up 1.3% year over year — a record for September and the 39th consecutive month of year-over-year gains (National Association of Realtors). The 2019 median was $274,600; over seven years, prices rose about 52%. The price-to-income ratio reached 5.1 in 2024, the highest on record: from 2019 to 2024, the median home price rose 48% while median household income rose only 17%. With a 20% down payment, the annual income needed to buy a median-priced home was about $51,000 in 2019 and about $96,000 in 2024.
The S&P Cotality Case-Shiller National Index rose 2.1% year over year in August 2026, but after adjusting for inflation, home prices have now fallen for 15 consecutive months — nominal prices are still rising while real purchasing power shrinks.
Mortgage rates: the Freddie Mac survey put the 30-year fixed rate at 7.18% in the week ending November 5, 2026. It fell to 5.98% on February 26, 2026, the first reading below 6% in three and a half years. The historical high was 18.63% in October 1981; the historical low was 2.65% in January 2021.
3. What one point is worth
A study published in October 2026 in Emerald's International Journal of Housing Markets and Analysis put a number on it. Using 2,332 single-family listings in the Greater Houston area, the authors found that each additional GreatSchools point was associated with a 4.57% higher list price — about $15,733 at the sample median price of $344,082. The relationship between rating and price was linear.
The same study found that the Texas Education Agency's official rating was not significant in the joint regression — the market trusts the GreatSchools rating, not the state government's official rating.
The extreme cases are on Realtor.com's list: the Beverly Hills Unified School District in California carries a 689% premium ($3.8 million versus $550,000 in Los Angeles County); Highland Park in Texas carries a 632% premium ($1.8 million versus $277,000 in Dallas County).
4. Why it costs more: the property-tax chain
Funding for American public schools depends heavily on local property taxes. According to National Center for Education Statistics data for the 2022–23 school year, property taxes accounted for 33.2% of all public elementary and secondary school funding — the single largest tax source — and about 83% of local school revenue. The funding mix was 45.1% from state governments, 42.0% from local sources, and 12.9% from the federal government, for total public school funding of $981.8 billion.
That is an institutional fact, not a causal claim: districts with higher home prices have a larger property-tax base, and local school funding is correspondingly larger. District, home price, and school funding are linked in a single chain.
5. The buyers: first homes at age 40
The National Association of Realtors' 2026 Profile of Home Buyers and Sellers (published November 5, 2026, covering transactions from July 2025 through June 2026) reports that first-time buyers made up 22% of buyers, with a median age of 40 — still the highest on record. A record 10% of first-time buyers paid all cash, and 28% of those paid with an inheritance (against 9% of buyers who took out a mortgage); the median age of all-cash first-time buyers was 54, against 38 for buyers with a mortgage.
A typical starter home (listings priced below $350,000) listed at $344,000 in June 2026, against $256,000 in June 2019; buyers needed household income of about $78,000, against $43,000 in 2019 — an increase of more than 80% (Realtor.com).
The NAR chief economist's office estimates that buying at 40 rather than 30 costs a typical starter-home buyer about $150,000 in lifetime equity. That is an NAR estimate, not a price forecast.
On supply, Realtor.com's 2026 Housing Supply Gap Report put the 2025 gap at 4.03 million homes (3.8 million in 2024); 1.82 million millennial and Generation Z "missing households" — young adults who have not formed independent households because they cannot afford to — the highest in four years.
6. The cost of holding: taxes and insurance
Property taxes vary enormously by state. The Tax Foundation's 2026 table (based on 2024 American Community Survey data) puts New Jersey and Illinois highest at 1.88% each, and Hawaii lowest at 0.29%. The median American homeowner pays $3,211 a year. On a $400,000 home, New Jersey charges $7,520 a year against Hawaii's $1,160 — a difference of $6,360 a year. The state and local tax (SALT) deduction cap rose from $10,000 to $40,000 in 2025 and returns to $10,000 in 2030.
Insurance is rising too. Insurify's 2026 Insuring the American Homeowner Report puts the national average annual premium at $2,948 at the end of 2025, up 12% in 2025 and expected to reach $3,057 by the end of 2026 — a fifth consecutive annual increase and a cumulative 46% rise since 2021. Florida is the most expensive, at $8,292 at the end of 2025; California stood at $2,455 at the end of 2025 and is expected to reach $2,843 in 2026, up 16% — the largest increase of any state, linked to losses from the January 2025 Palisades and Eaton wildfires.
7. The movers: out of California, into Texas
The Census Bureau's Vintage 2025 estimates (July 1, 2024 to July 1, 2025) show California with domestic net migration of −229,077 people, the lowest in the nation, and Texas at +67,299, the second highest. The 2024 American Community Survey counted 77,161 people moving from California to Texas, the largest single interstate flow in the country; California saw 661,205 people leave in 2024, the most of any state.
Rents are diverging too. The Zillow Observed Rent Index put the typical market rent at $1,932 a month in September 2026, up 2.7% year over year. A Zillow study published October 7, 2026, found that a renter earning $100,000 a year could afford a median home of only 650 square feet — one bedroom, one bathroom, 95% apartments or condominiums — in San Jose, but a 2,100-square-foot detached house in Memphis.
8. The Chinese American view: where the numbers sit
Home prices in areas with large Chinese populations (Zillow Home Value Index, September 2026): California's typical home value was $761,538, up 0.6% year over year; New Jersey's was $575,123, up 4.0%; Texas's was $296,424, down 1.4%. The national typical value was $368,697 (August 2026). The ZHVI covers all homes, including those not for sale, and is measured differently from the NAR existing-home median.
The Census Bureau's Current Population Survey/Housing Vacancies Survey put the homeownership rate for Asian, Native Hawaiian, and Pacific Islander (ANHPI) households at 62.3% in the third quarter of 2026, against 65.5% nationally. The Census Bureau's Wealth of Households: 2024 (published July 2026) found that nearly 29% of Asian households had net worth of $1 million or more — the wealthiest group in the country in 2024 — but that Asian homeownership (58.5% on the Survey of Income and Program Participation measure) was below that of non-Hispanic white households (70.2%), while 46.3% of Asian households held stocks or mutual funds directly.
It must be stated plainly: no systematic public data were found on home-buying preferences or school-district purchasing patterns among Chinese families in the United States, and this article makes no such claims.
9. Close: back to Southlake
Back in Southlake, Texas. The median home inside the Carroll Independent School District is still $2.16 million; outside the district it is still $439,967. The district line is drawn on the map; the price line is drawn in the same place. The house next to a good school is expensive; what the price tags is the district.
Source: 全美房地产经纪人协会等机构数据
Published by GSM · USA (original Chinese edition)
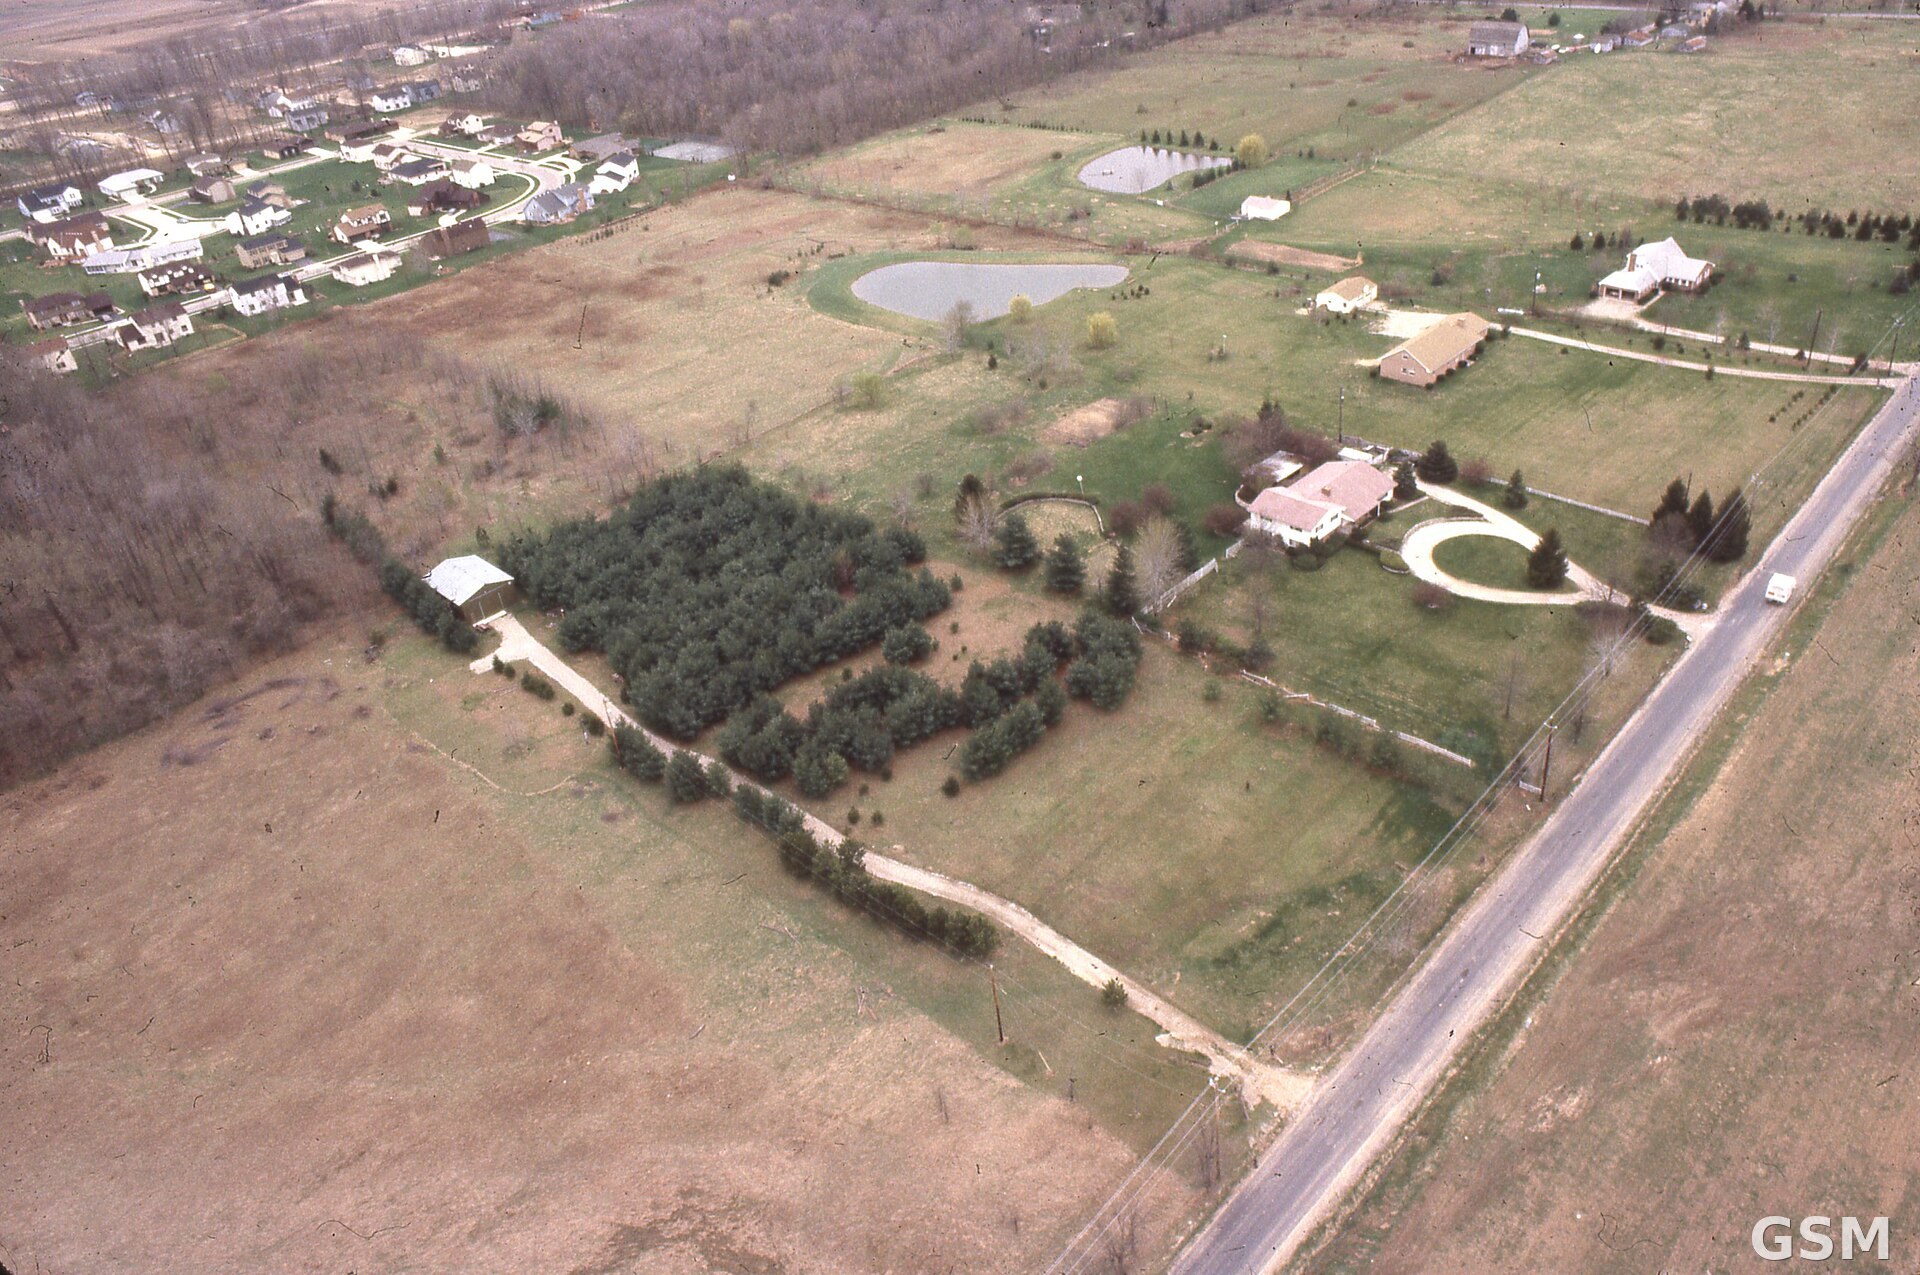
Photo: 图:美国郊区住宅区航拍。Wikimedia Commons,公共领域。 / Photo: Aerial view of a U.S. suburban residential neighborhood. Wikimedia Commons, public domain.