
U.S. Existing-Home Sales Fall 5.5% in October to 3.75 Million, Lowest Since August 2010
The National Association of REALTORS (NAR) reported on November 12 in Washington that U.S. existing-home sales fell to a seasonally adjusted annual rate of 3.75 million in October, down 5.5% from September and 8.8% from a year earlier — the lowest level since August 2010.
"The average 30-year fixed mortgage rate was 7.33% in October," said NAR Chief Economist Lawrence Yun. "Except for a single month in 2023, these are the highest rates since 2000, and home sales consequently fell to the lowest level since August 2010, even though inventory has increased." Yun noted that distressed sales accounted for only 2% of transactions and that nearly all of the nation's roughly 88 million homeowners hold substantially more equity; if mortgage rates decline, he said, pent-up demand should be unleashed.
The median existing-home price was $416,700, up 0.4% from a year ago — the 40th consecutive month of year-over-year increases. Total housing inventory at month's end was 1.59 million units, up 1.3% from September and 4.6% from a year earlier, equal to a 5.1-month supply at the current sales pace, up from 4.7 months in September and 4.4 months a year ago. The housing affordability index stood at 100.7, down from 107.3 a year earlier.
Single-family home sales ran at an annual rate of 3.41 million, down 5.8% from September, with a median price of $421,900, up 0.3% year over year. Condo and co-op sales ran at 340,000 units, down 2.9%, with a median price of $365,100, down 1.6%.
Regionally, the West saw the steepest drop: sales fell 9.7% to an annual rate of 650,000, with a median price of $624,300, unchanged from a year ago. The South fell 6.5% to 1.73 million (median $360,900, down 0.4%); the Midwest fell 3.2% to 900,000 (median $324,300, up 1.5%); the Northeast was flat at 470,000 (median $519,600, up 3.2%).
First-time buyers accounted for 29% of sales, up from 27% a year ago; all-cash buyers were 29%; individual investors and second-home buyers were 20%, up from 17% in September and a year earlier. The median time on market was 35 days, up from 33 days in September.
Source: National Association of REALTORS
Published by GSM · USA (original Chinese edition)
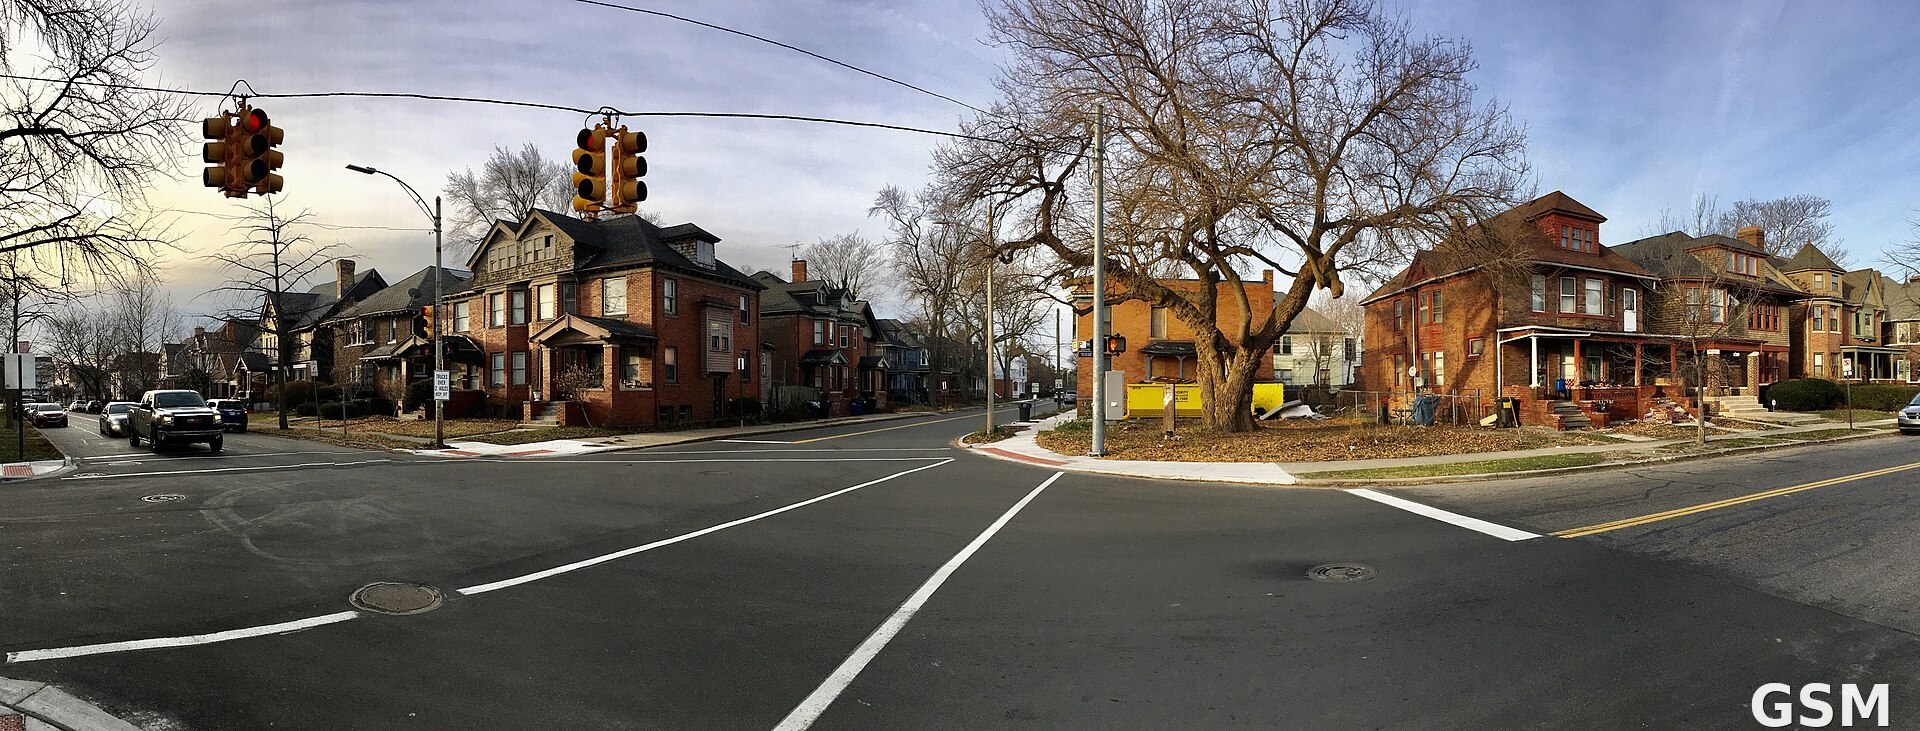
Photo: 图:底特律 West Village 住宅区(资料图)。Wikimedia Commons,CC BY-SA 4.0。 / Photo: West Village residential neighborhood, Detroit (file photo). Via Wikimedia Commons, CC BY-SA 4.0.