BTS Releases November 2026 Update of Supply Chain Indicators
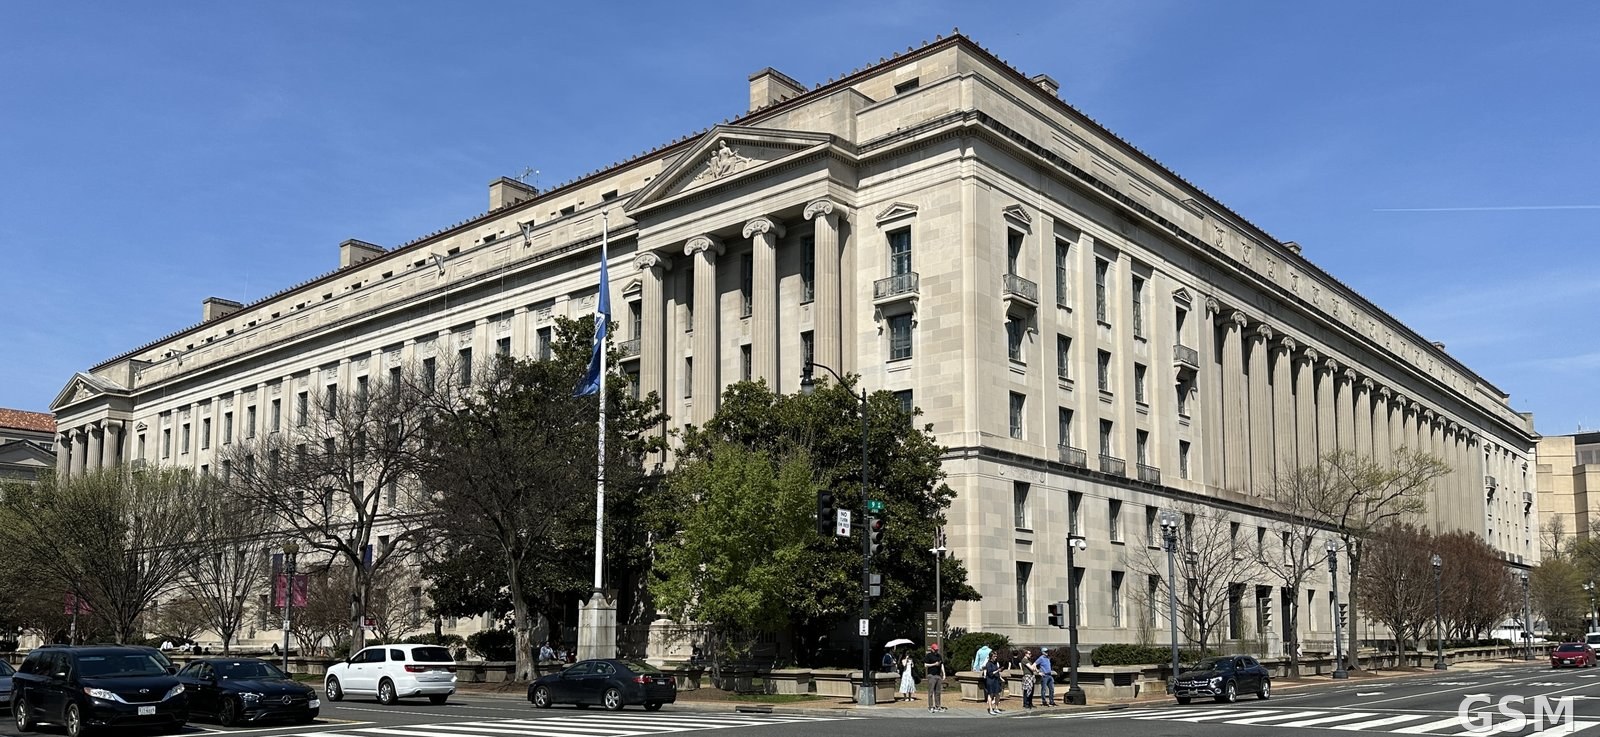
The U.S. Department of Transportation's Bureau of Transportation Statistics (BTS) on November 4 released its November 2026 update of the nation's Supply Chain Indicators, refreshing a wide range of data on supply chain and freight conditions.
The indicators are organized into four sections: Port Data - Inside the Gate, Port Data - Outside the Gate, Freight Movement, and Transportation Labor and Capacity Tightness. This month's updates include the capacity of containerships calling at U.S. ports, loaded import containers, loaded and empty export containers, and the numbers of containerships anchored off U.S. ports and awaiting berths.
Rail and highway updates include average train speed, rail cars online, average dwell times at Class I railroad terminals, rail non-intermodal carloads and intermodal units, average truck speeds and planning time indexes at 10 bottleneck locations, and truck speeds around the Port of Los Angeles/Long Beach and the Port of New York/New Jersey.
Price and macroeconomic updates include freight rates from the U.S. to Shanghai and from Shanghai to Los Angeles, the Freight Transportation Services Index, producer price indexes for trucking and diesel fuel, U.S. diesel sales prices, downbound grain barge rates, personal consumption expenditures and the total business inventory-to-sales ratio.
BTS began tracking supply chain indicators in 2020 at the direction of the White House. The Department of Transportation convenes the interagency working group behind the data, which includes DOT modes and the U.S. Departments of Agriculture, Energy, Commerce and Labor.
(Source: U.S. Bureau of Transportation Statistics)
Source: U.S. Bureau of Transportation Statistics
Published by GSM · USA (original Chinese edition)
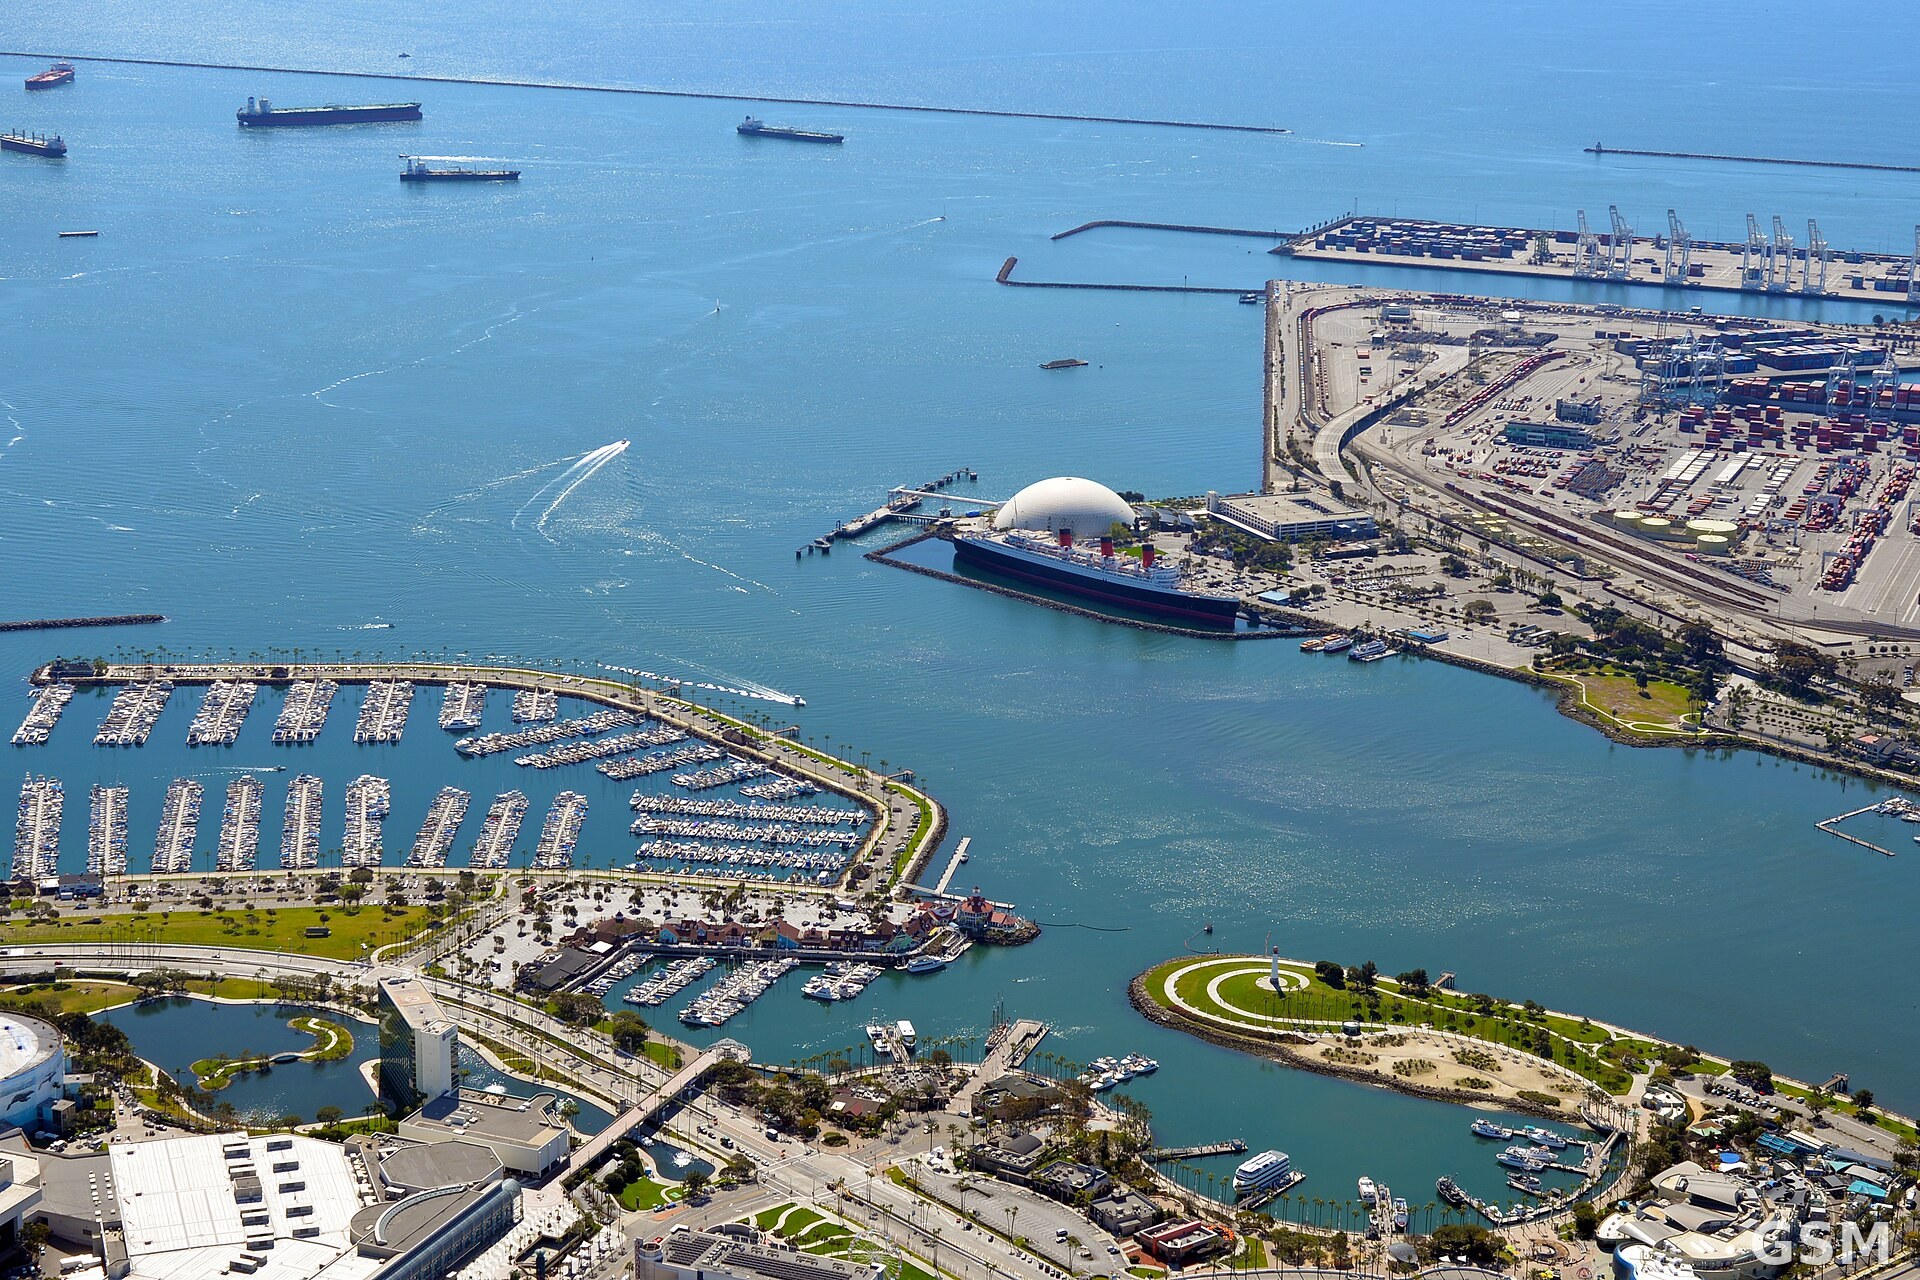
Photo: 图:长滩港集装箱码头航拍。Don Ramey Logan 摄,CC BY-SA 4.0,经 Wikimedia Commons。 / Photo: Aerial view of the Port of Long Beach container terminals. Photo by Don Ramey Logan, CC BY-SA 4.0, via Wikimedia Commons.